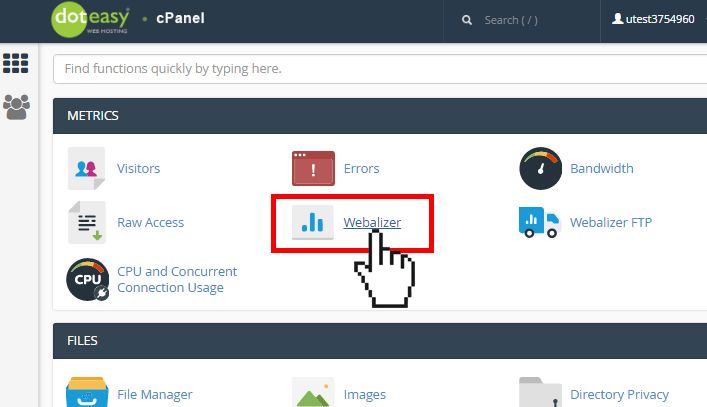
To access the Errors section in cPanel, navigate to Metrics and click on Errors. The interface shows the latest 300 error messages in reverse order. Each log entry includes the timestamp, module, severity level, process ID, thread ID, client IP, and a detailed error description.
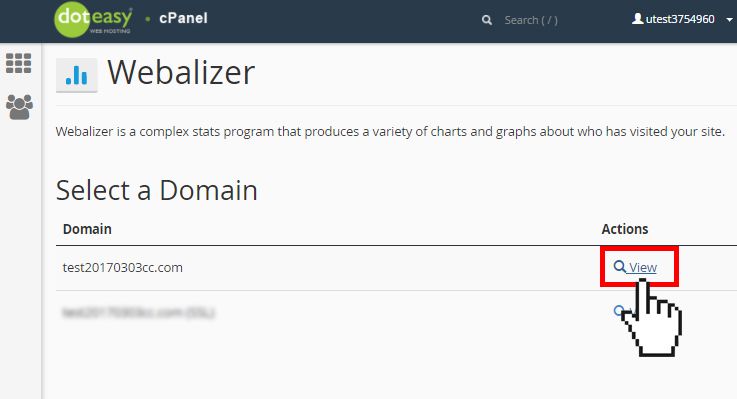
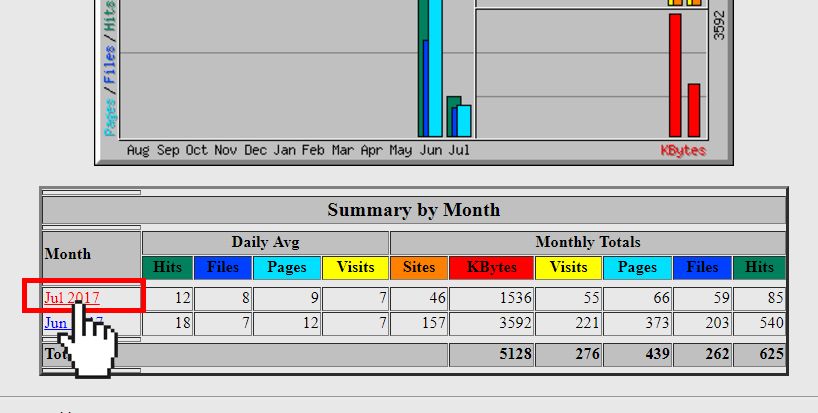
To access FTP statistics using cPanel, navigate to 'Metrics' and select ''Webalizer FTP''. Within the Webalizer FTP interface, click on the link to view statistics for your domain. To see detailed monthly statistics, click on the respective month's link.
To access Visitors metrics in cPanel, click on ''Visitors'' under 'Metrics'. Click the magnifying glass icon next to the domain to view visitor details. Default info includes IP, time, size, referring URL, and user agent. Customize data view by clicking the gear icon and selecting desired options. HTTP status codes indicate loading success or error
Our website uses cookies for essential functions, analytics, and advertising. By clicking 'Accept', you consent to our cookie policy and data use.